For Jira Cloud · Free for 30 days
See who logged what, and who didn't.
The worklogs your team already logs in Jira, turned into a team timesheet, a capacity report, and a PDF you can send. Nothing to set up.
Spot it. A working day with nothing logged gets a red outline in the team timesheet.
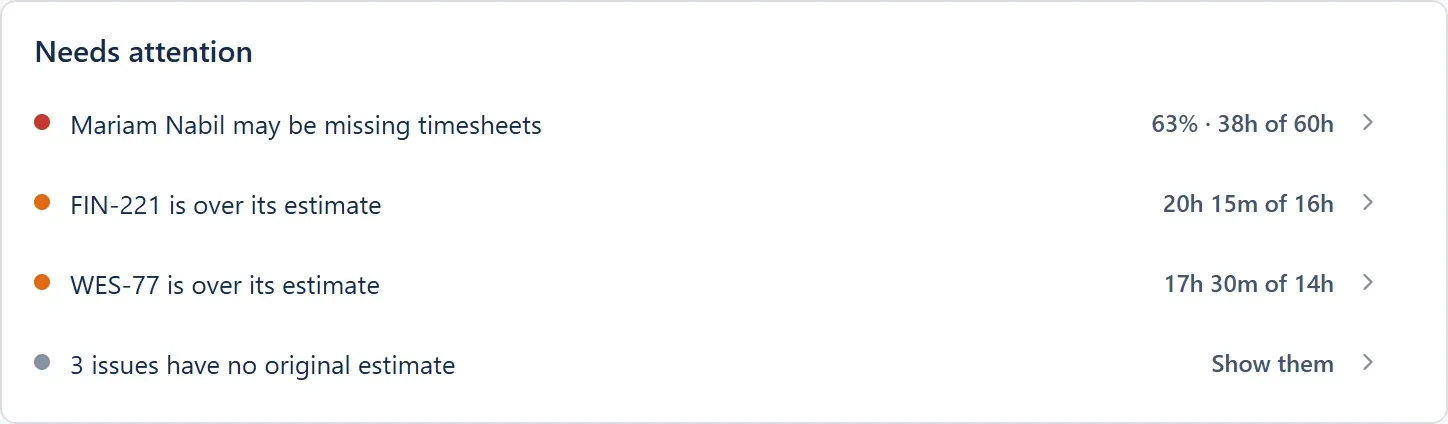
Act on it. Needs attention names the person and how far below capacity they are.
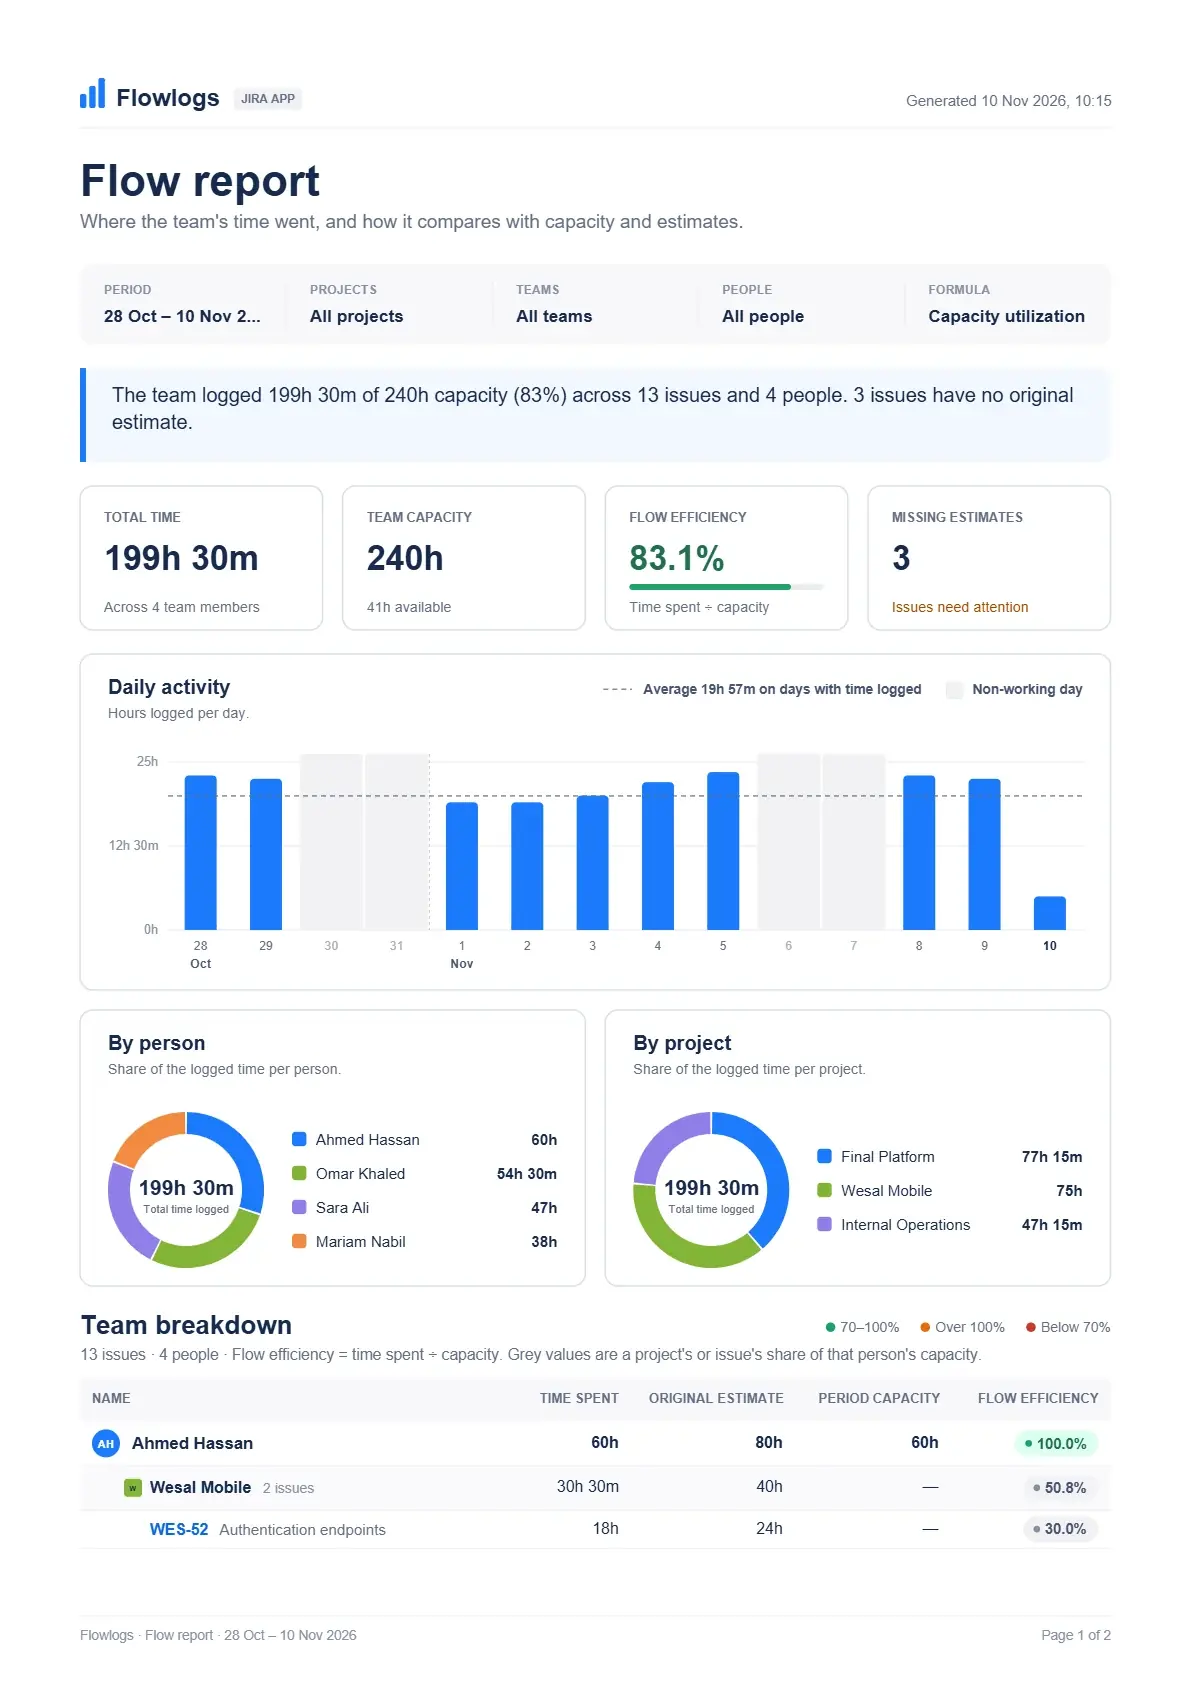
Report it. One click sends the same picture to management as a clean A4 PDF.
Runs on Atlassian Forge · No data leaves Jira · Arabic names in every export

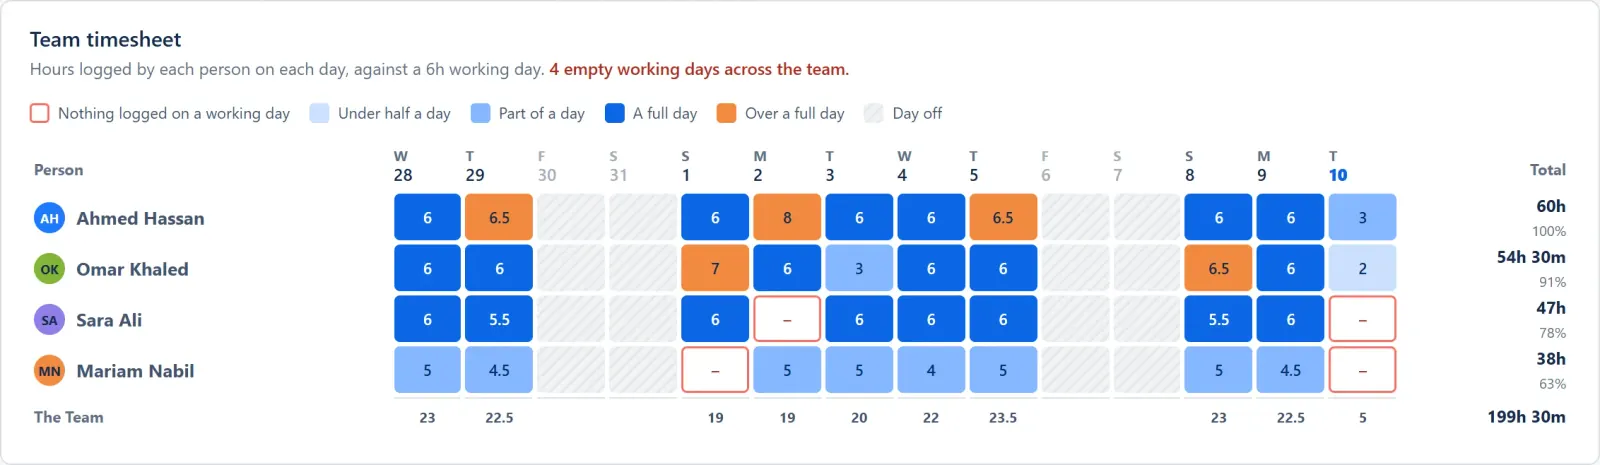 Nothing logged on a working day
Free for 30 days
No license fees or user limits
Reads existing Jira worklogs
No double entry
Data stays in Atlassian
Runs on Atlassian Forge
Arabic-ready exports
Names render right in PDF, Excel and CSV
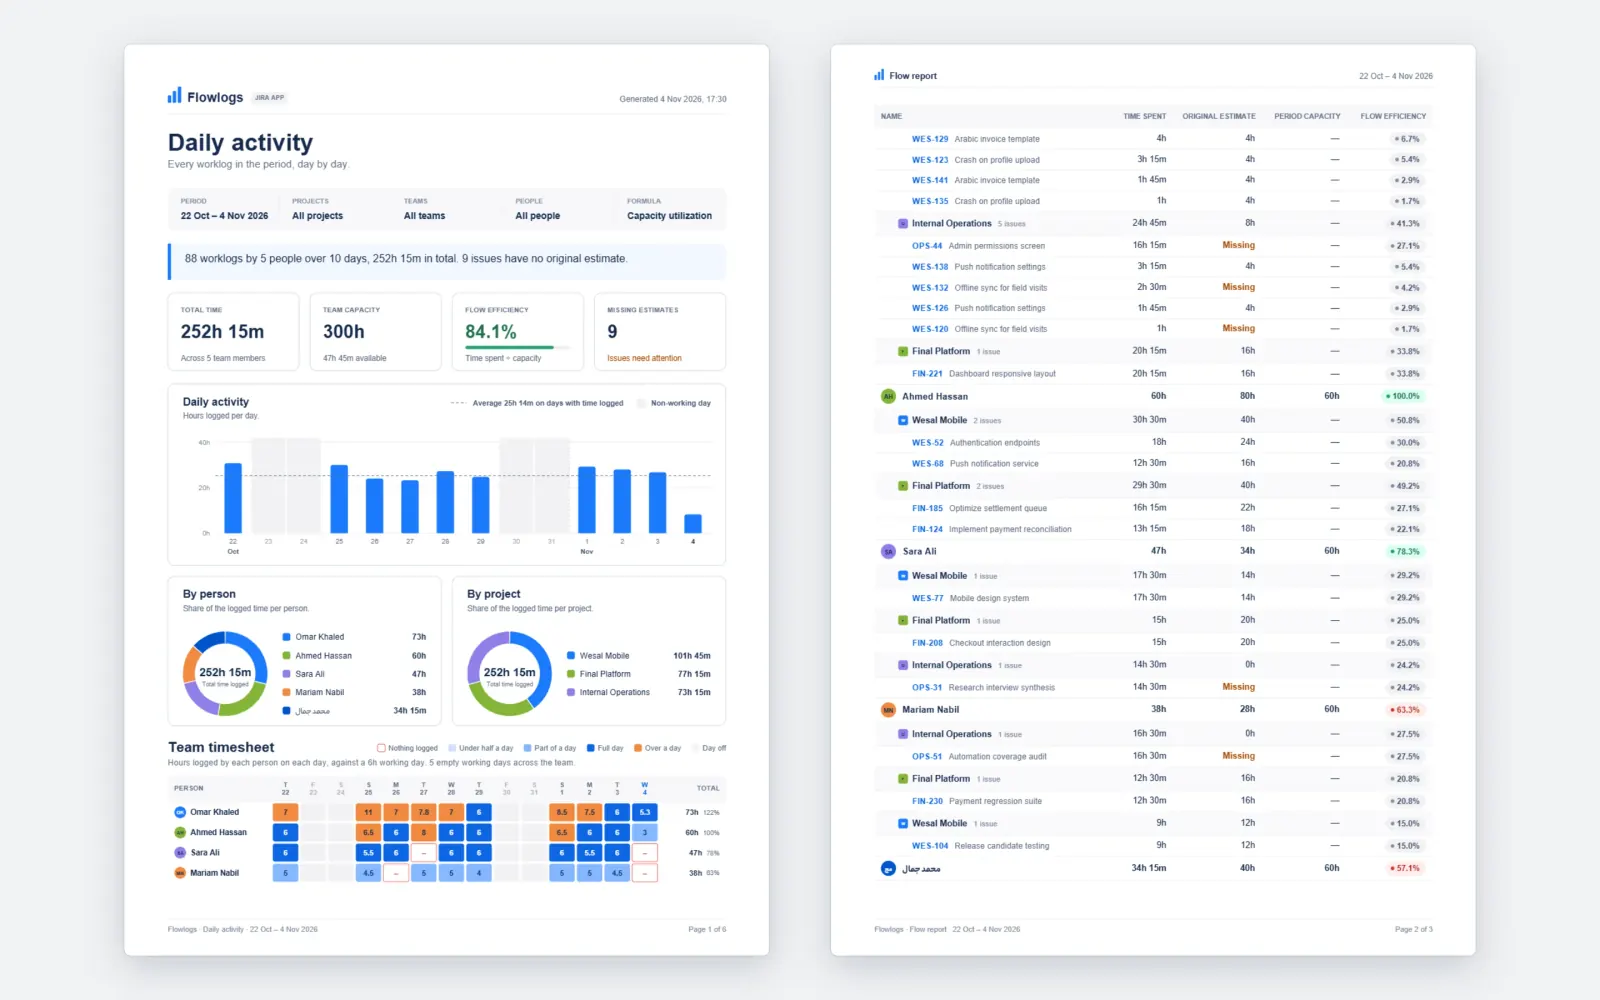
Inside the flow report
Your team's whole period, on one Jira page
Open it in Jira
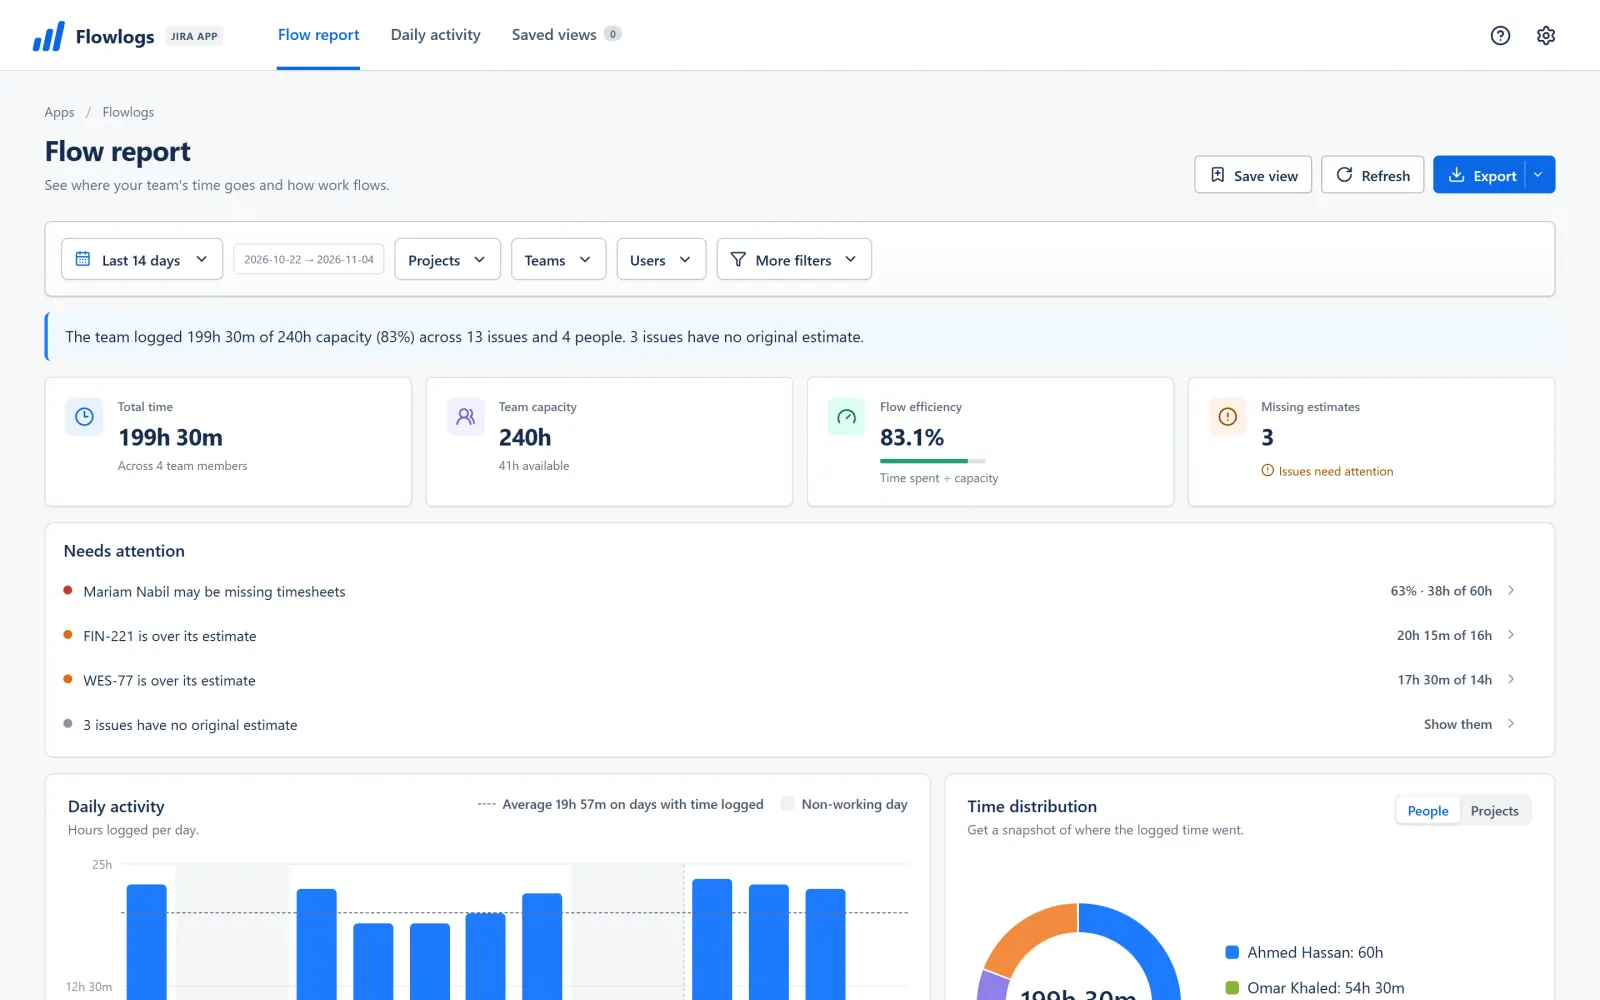
Nothing to set up. Flowlogs reads the worklogs your team already keeps in Jira.
The period in one sentence
Hours logged against capacity, across every issue and person, before you scroll.
Four numbers that matter
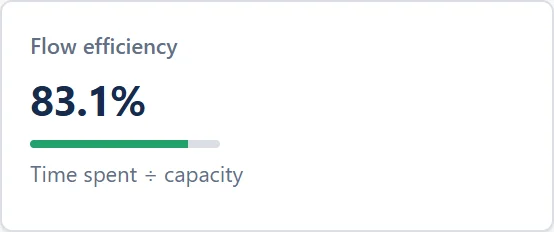
Total time, team capacity, flow efficiency and missing estimates, side by side.
Who needs you, by name
Needs attention flags missing timesheets and issues running over their estimates.
Every day, every person
Hours per day against the team average, and where the time went.
Down to every issue
Each person's time against estimate and capacity, with flow efficiency in colour.
Send it as a PDF
One click on Export, and management gets the same picture as a clean A4 report.
Open it in Jira
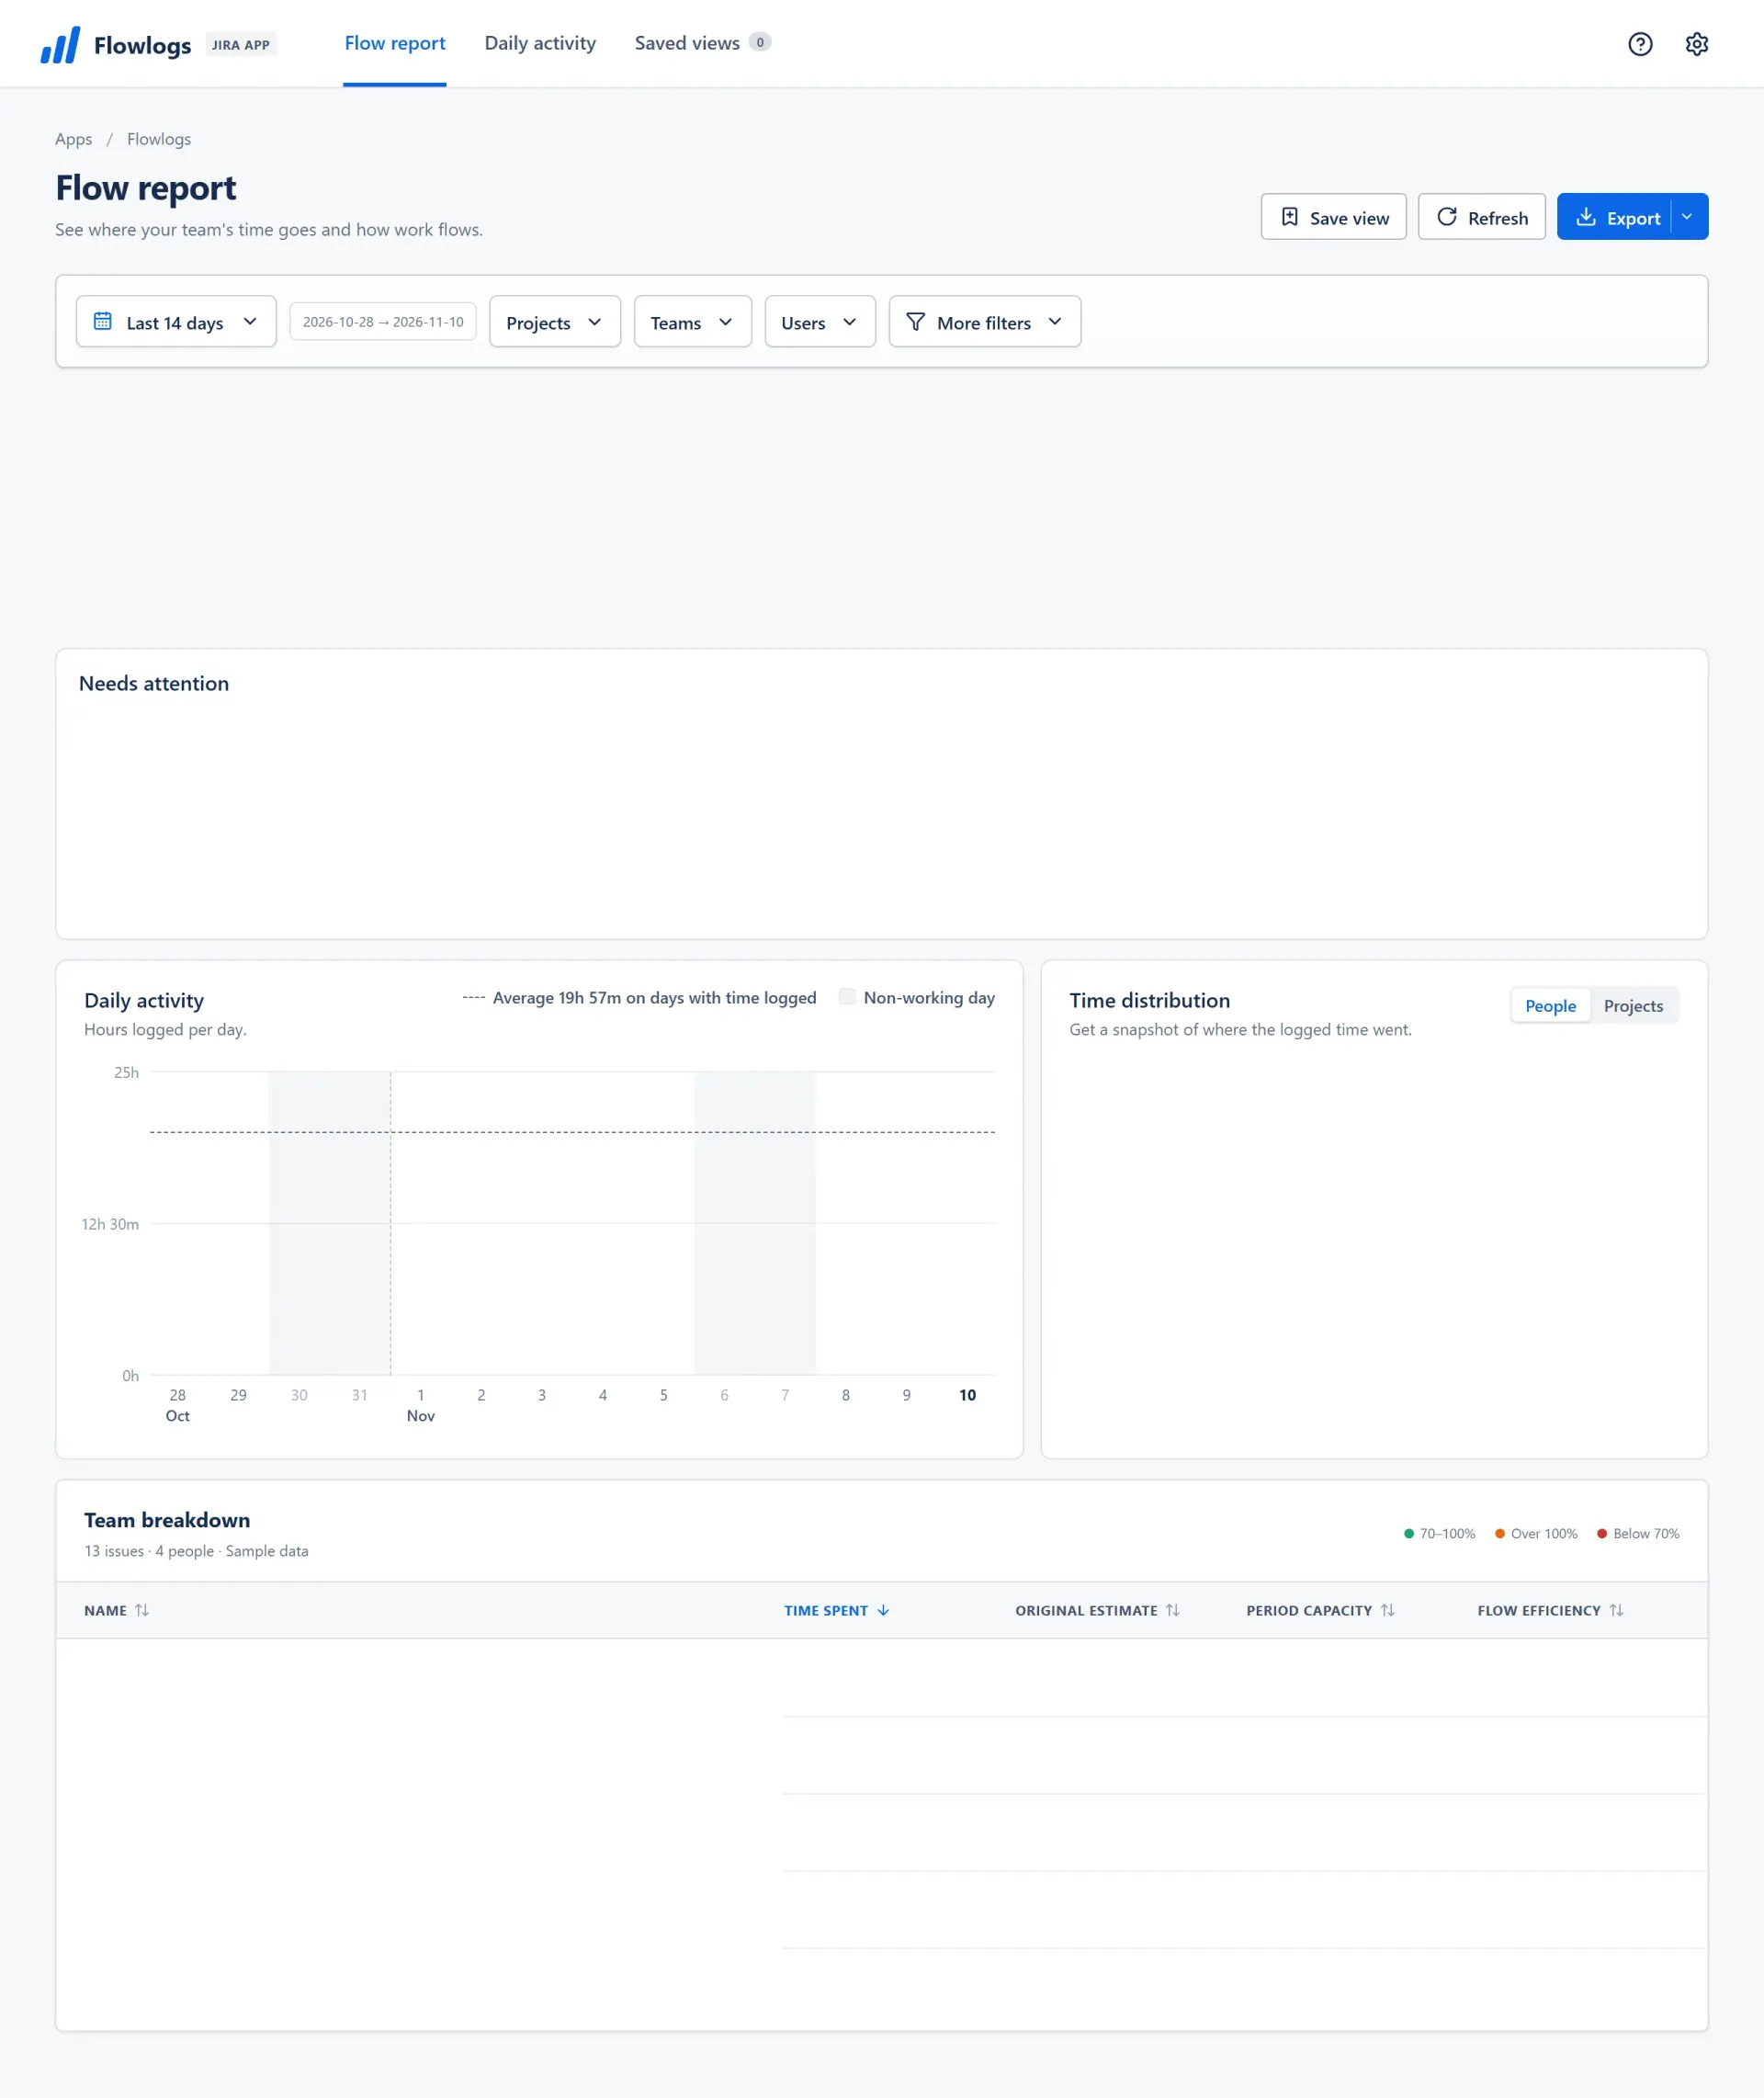
Nothing to set up. Flowlogs reads the worklogs your team already keeps in Jira.
The period in one sentence
Hours logged against capacity, across every issue and person, before you scroll.
Four numbers that matter
Total time, team capacity, flow efficiency and missing estimates, side by side.
Who needs you, by name
Needs attention flags missing timesheets and issues running over their estimates.
Every day, every person
Hours per day against the team average, and where the time went.
Down to every issue
Each person's time against estimate and capacity, with flow efficiency in colour.
Send it as a PDF
One click on Export, and management gets the same picture as a clean A4 report.
One missing timesheet, start to finish
From an empty day to a report in three clicks
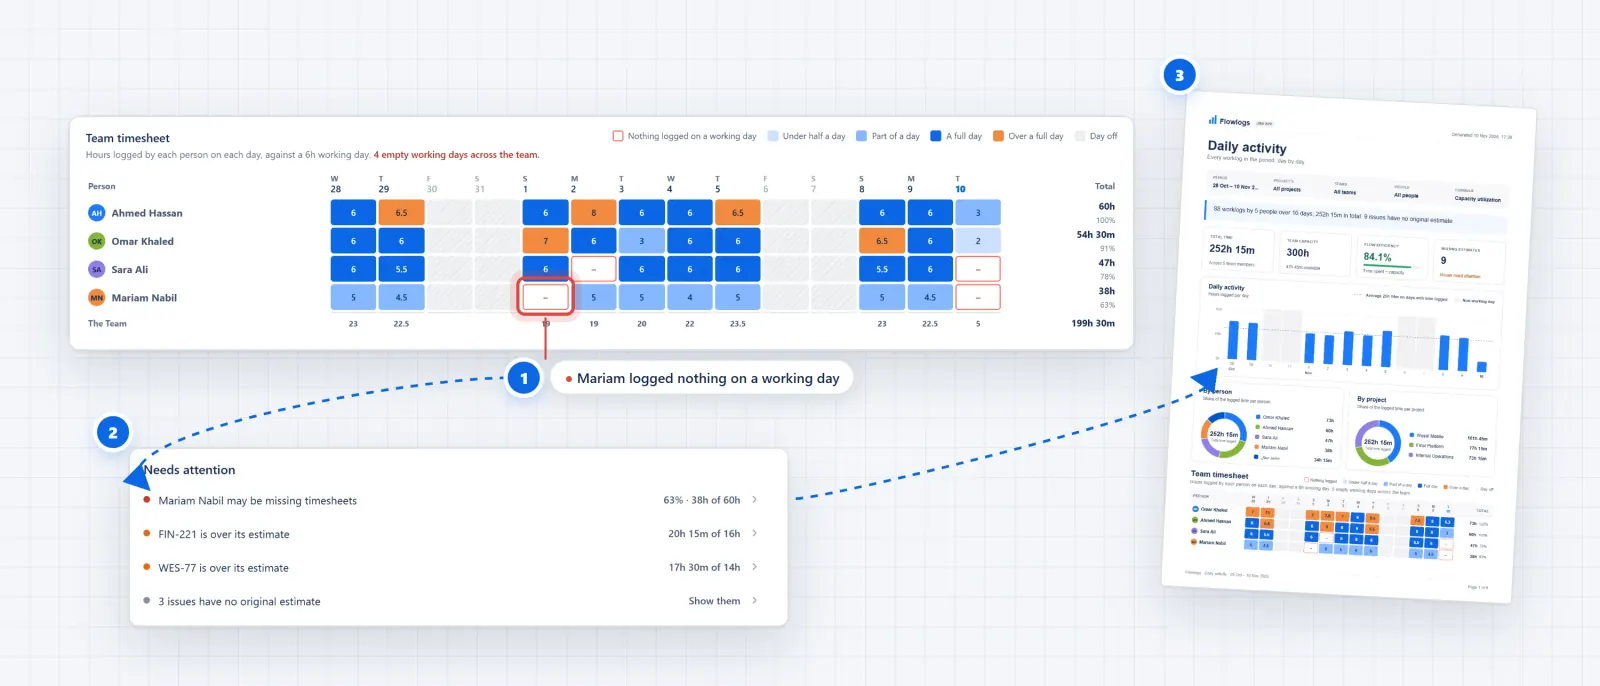
Spot it
A working day with nothing logged gets a red outline in the team timesheet.
Act on it
Needs attention names the person and how far below capacity they are.
Report it
One click sends the same picture to management as a clean A4 PDF.
Sound familiar?
Timesheet day shouldn't mean open tabs and guessing games
Chasing people for timesheets every Thursday.
Opening one profile after another to find out who forgot to log yesterday's work.
Exporting worklogs to a spreadsheet to answer one question.
Downloading CSV files and writing formulas just to compare logged hours with sprint capacity.
Guessing whether the team has capacity for the next sprint.
Committing to work without knowing who is stretched and which issues are running over their estimates.
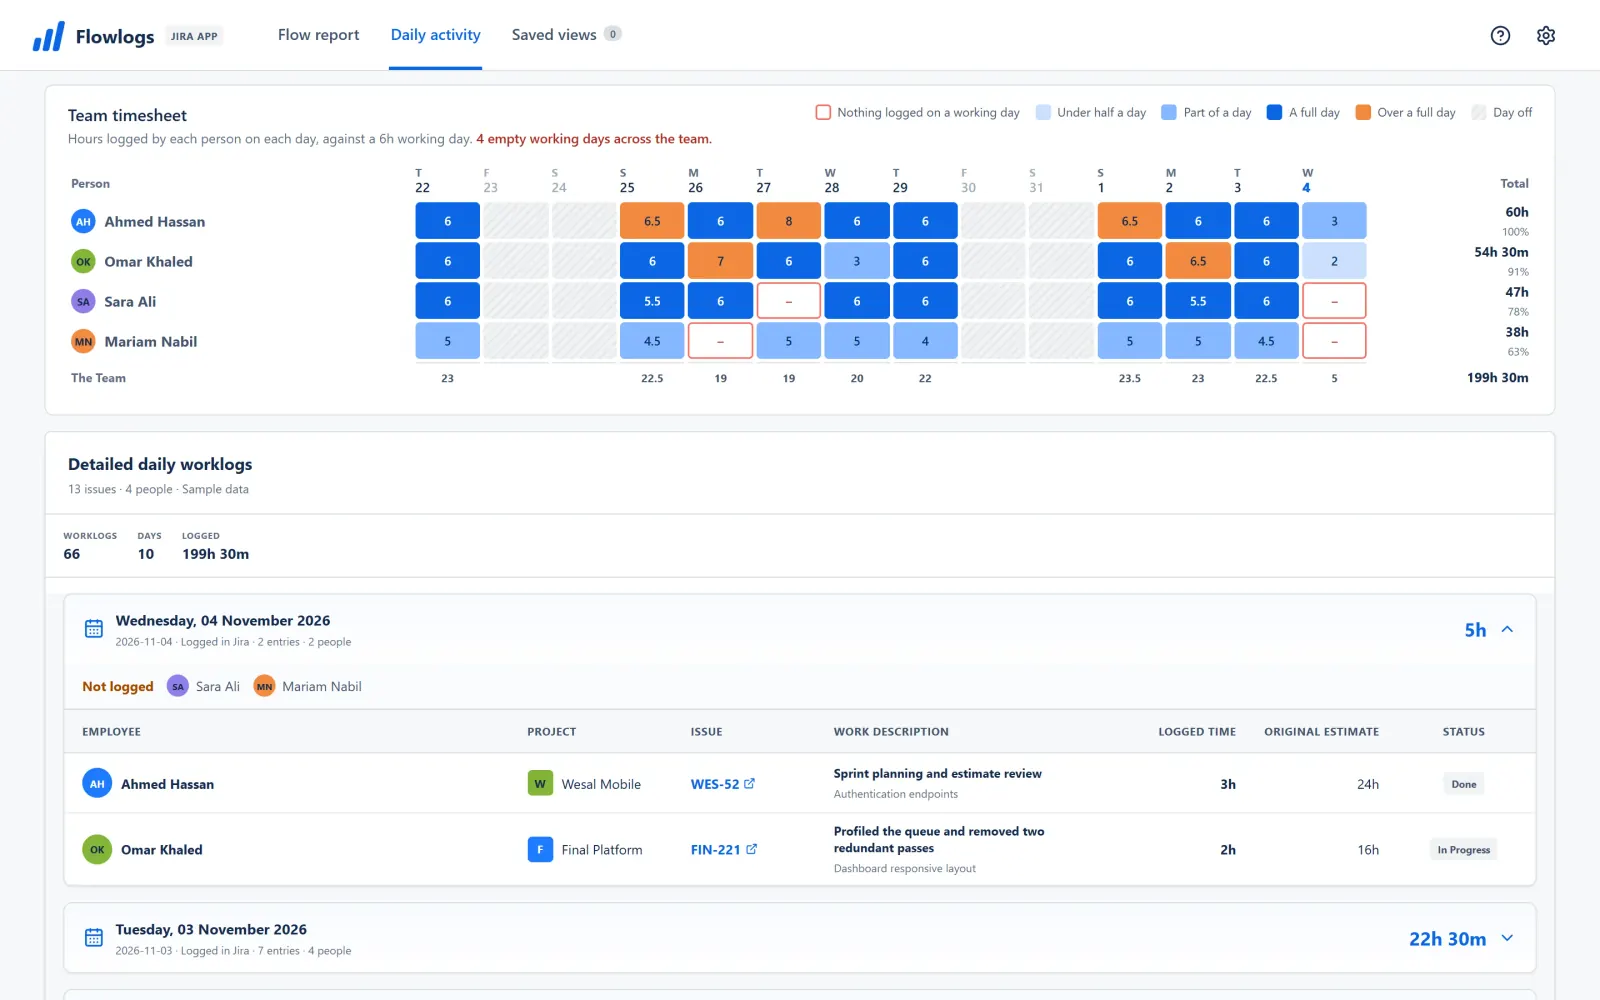
Team timesheet
Missing timesheets stand out
Every person, every day, coloured against a working day. A day with nothing logged gets a red outline, so you know who to nudge before the sprint review. Click a day to see the worklogs behind it.
- Colours for under half a day, part of a day, a full day and over a full day
- Click a day to jump straight to its worklogs
Flow report
Capacity and estimates in one view
Total time, capacity and flow efficiency at the top, a short Needs attention list under it, and every number traceable from person to project to issue.
- Issues over their original estimate are listed in Needs attention
- Flow efficiency shows time spent against capacity
Share it
A report that explains itself
A clean A4 PDF with the charts and the timesheet, or Excel and CSV that match the screen exactly. Nothing to reformat before it goes to management.
Getting started
Up and running in minutes
Step 1
Install from the Marketplace
A Jira site administrator installs Flowlogs from the Atlassian Marketplace in a few clicks.
Step 2
Open Apps, then Flowlogs
Flowlogs opens from the Apps menu in Jira. No new accounts or passwords.
Step 3
Pick your date range
The worklogs your team already keeps in Jira fill the reports, the team timesheet and the charts.
Privacy & architecture
Your Jira data stays in Jira
Flowlogs runs on Atlassian Forge and sends nothing to servers outside Atlassian.
Reads Jira as you
Each person sees only the projects, issues and worklogs their Jira permissions already allow.
Atlassian Forge storage
Settings and saved views are kept in Atlassian Forge storage, nowhere else.
No external servers
No servers of our own, no analytics and no tracking scripts.
Client-side exports
PDF, Excel and CSV files are created in your browser and saved to your device.
Choosing the right tool
Is Flowlogs right for your team?
How Flowlogs compares with spreadsheet exports and full time-tracking suites.
Built for Jira teams

Flowlogs
Reports from the worklogs already in Jira
- Setup
- Install and open
- Cost
- Free for 30 days, then a low price per user
- Team timesheet view
- Built in, with empty days outlined
- Capacity vs estimates
- Calculated for you
- PDF report
- One-click A4 PDF
- Approvals and billing
- Not included
Spreadsheet exports
Export from Jira, then build it yourself
- Setup
- Manual export each week
- Cost
- Included in Office
- Team timesheet view
- Formulas and pivot tables
- Capacity vs estimates
- Lookups and formulas by hand
- PDF report
- Print preview from Excel
- Approvals and billing
- Not included
Full time-tracking suites
Time tracking, approvals and billing in one
- Setup
- Team onboarding and new habits
- Cost
- Paid per user
- Team timesheet view
- A separate dashboard
- Capacity vs estimates
- Built-in complex models
- PDF report
- Custom report builder
- Approvals and billing
- Approvals and client invoicing
Who it is for: Flowlogs is built for Jira teams and their leads who want to see logged time and capacity without the cost and setup of a billing suite.
Frequently asked questions
Everything you need to know
How much does Flowlogs cost?
Flowlogs is paid per user through the Atlassian Marketplace, after a 30-day free trial. Atlassian bills it at the same user tier as your Jira site.
Does any data leave Jira?
No. Flowlogs runs entirely on Atlassian Forge: its code runs in Atlassian's cloud, its settings stay in Forge storage, and exports are created in your browser.
Which date does a worklog count on?
On the day they were logged in Jira, so a report for last week shows exactly what was entered last week. Capacity follows the hours per day and days per week you set.
Who can see what?
Flowlogs reads Jira as the person using it, so each person sees only the worklogs and issues Jira already shows them.
Does it support Arabic?
Arabic names and text display correctly on screen and in every export, including the PDF. The app itself is in English; this website is also available in Arabic, Spanish, French and German.
Know where your team's time went, in one Jira page.
Nothing new for your team to learn. Flowlogs reads the worklogs they already keep in Jira.